Quarterly Tourism Monitor 4Q2020: Highlights & Infographic
The PATA Quarterly Tourism Monitor (QTM) provides a quantitative view of the arrivals into all major destinations within the Asia Pacific region, comparing visitor arrivals by source market and percentage change against the previous year on a quarterly basis. The numbers have been released for the fourth quarter of 2020.
To complement the report’s quantitative data, PATA also releases an accompanying set of highlights and infographic that provides context to the numbers. The highlights and infographic are available below to our newsletter subscribers as well as PATA members and Chapter members.
Sign in to access QTM 4Q2020 highlights & infographic:
To create an account as a PATA International Member, Corporate Member, Youth Member or Chapter Member, please send us a message. Not a member? Sign up as a non-member to access free publications and content.
Topline Summary
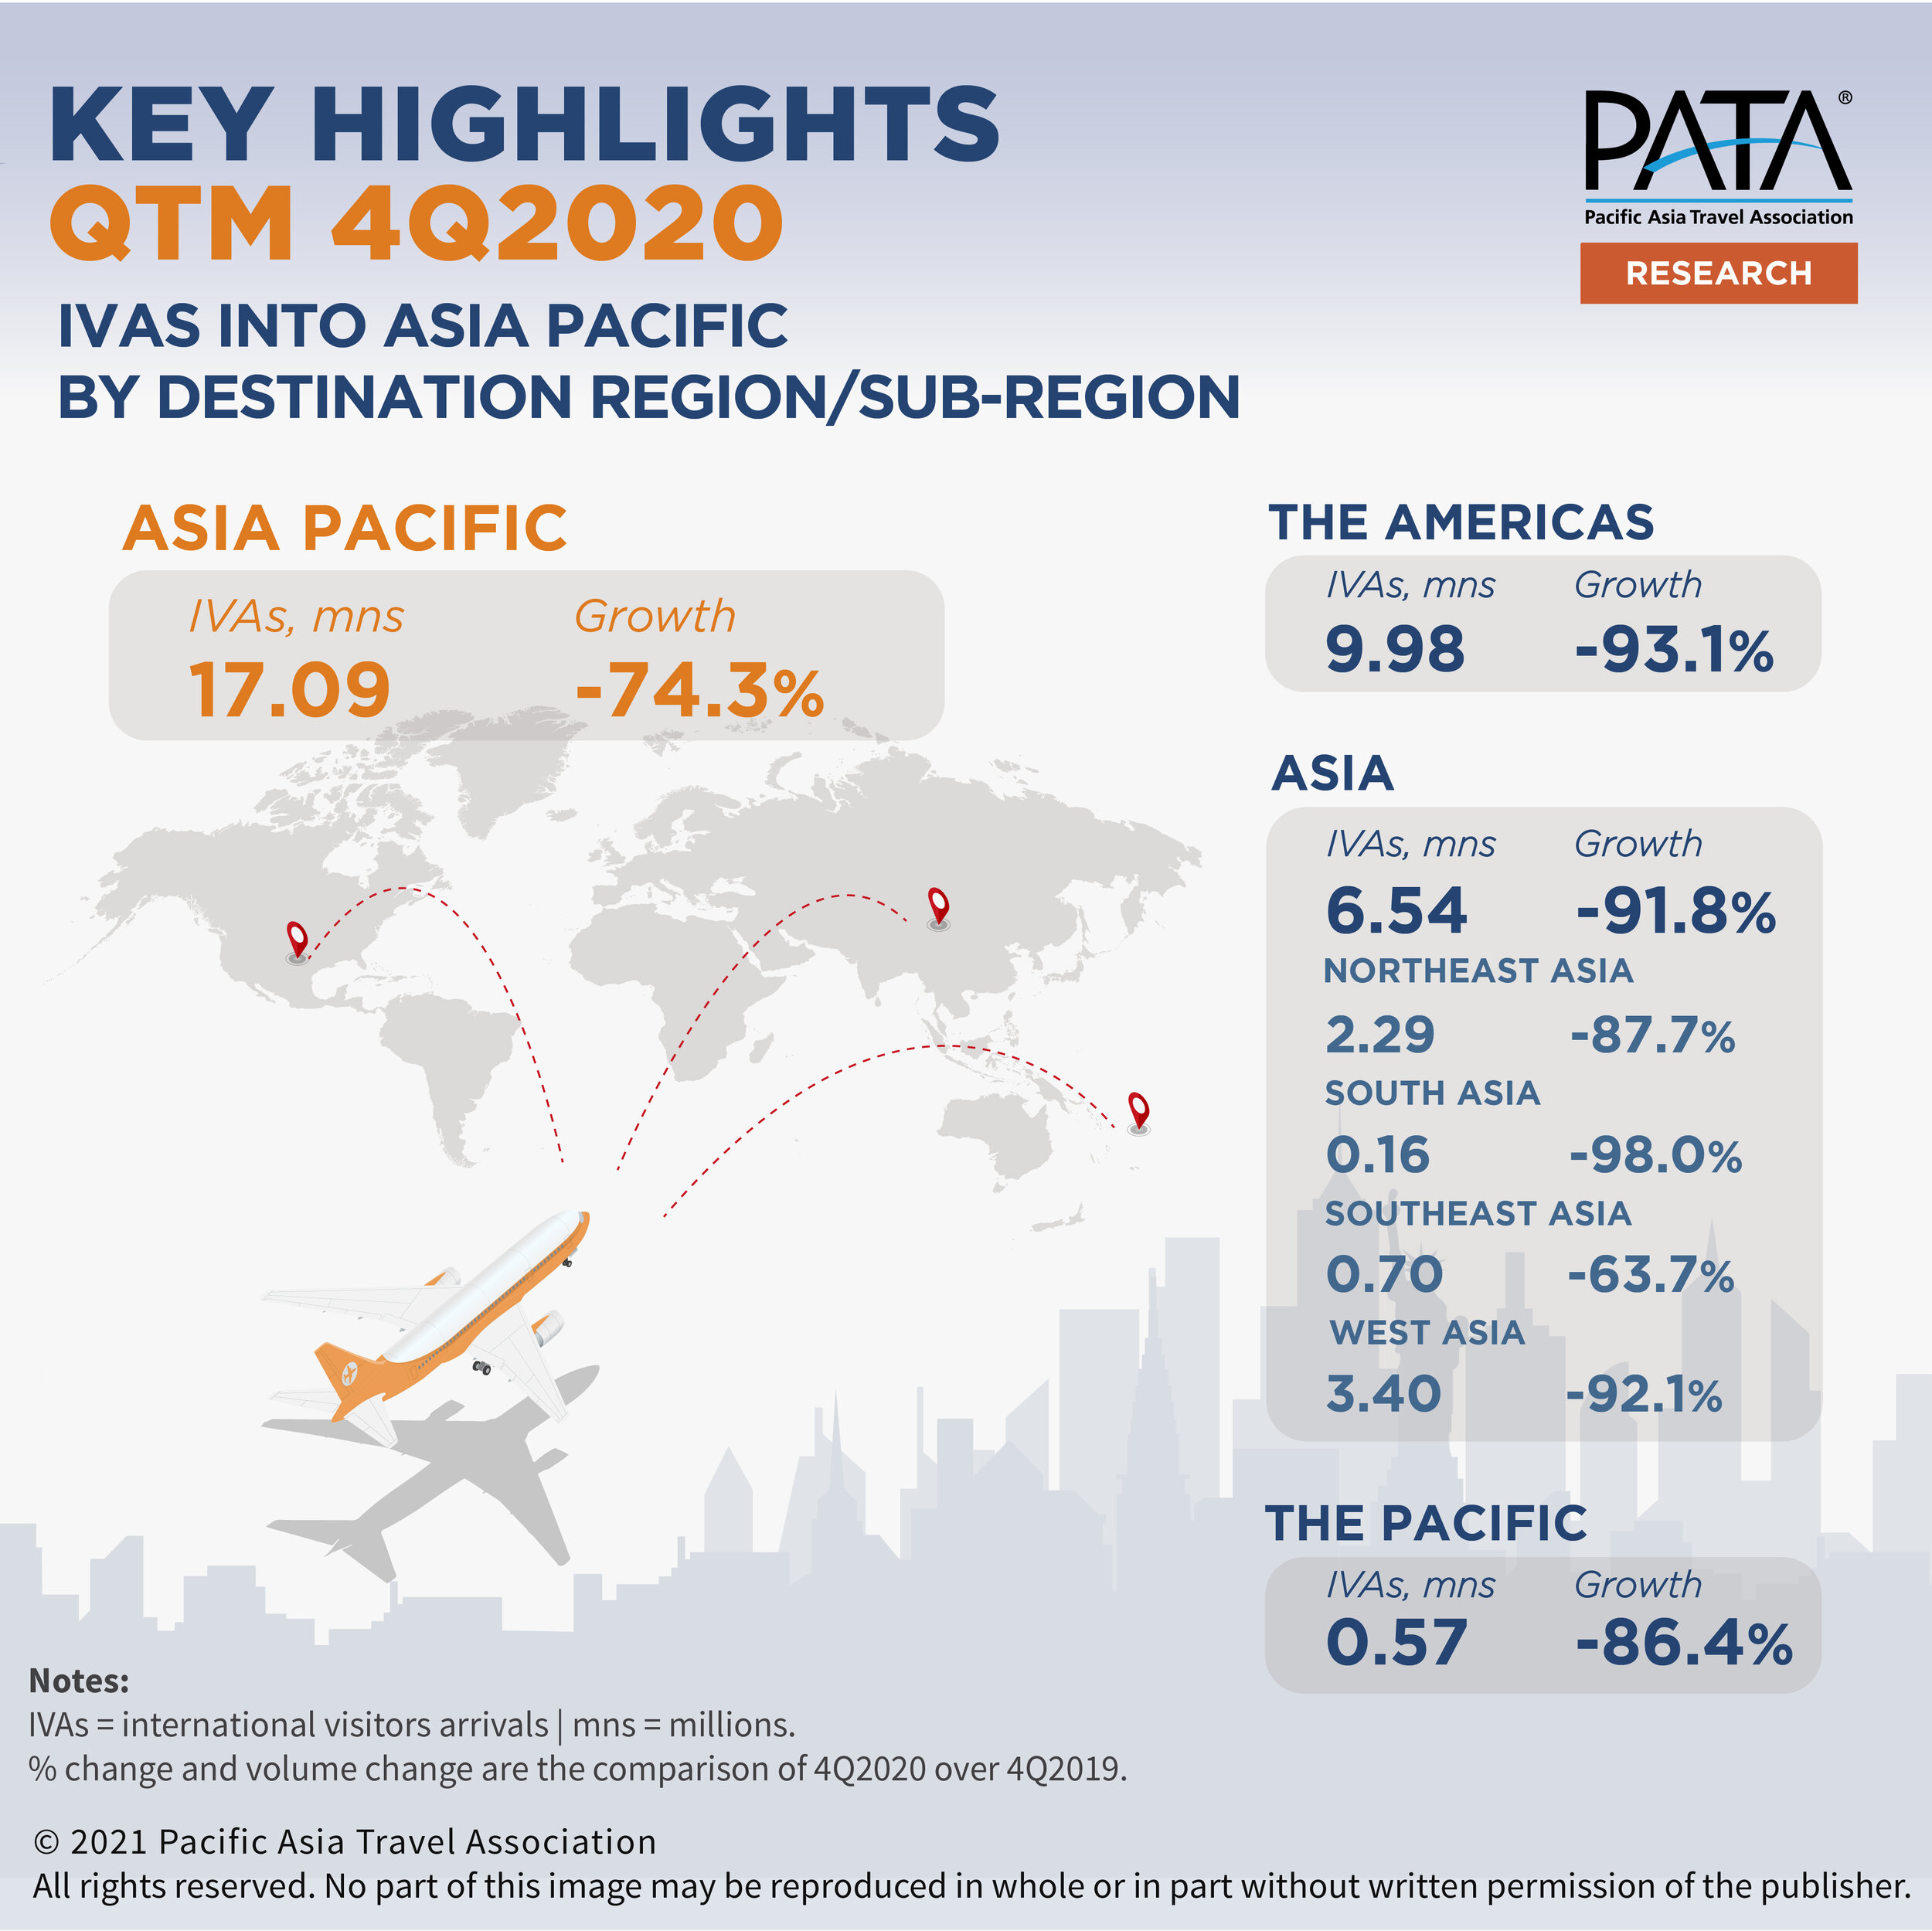
The COVID-19 pandemic continues to have a major impact on international tourism in Asia Pacific during 4Q2020. This was confirmed by the significant decline of over 86 percent international visitor arrivals (IVAs) into 37 Asia Pacific destinations that have released fourth quarter data. This translates to a loss of close to 109 million arrivals for the 3-month period from October to December 2020.
Key Highlights
The Americas region reported the highest volume of IVAs during the period in spite of a year-on-year drop of 74.3 percent, and when compared with the 3Q2020 the region saw an upward trend in its arrival traffic, driven largely by a dramatic gain of IVAs into Mexico (6.76 million IVAs).
Northeast Asia marked the largest decline in IVAs for another quarter, with a higher-than-overall contraction rate of 93.2 percent. Nevertheless, Japan; Macao, China, and Chinese Taipei all bounced back from the setback last quarter registering quarter-on-quarter visitor growth of 446.4 percent, 150.3 percent and 15.6 percent respectively.
Similarly in South Asia, although arrivals into the two reporting destinations – the Maldives and Nepal – were in decline for the period with year-on-year contraction rates of 65.9 percent and 98.4 percent respectively, they witnessed outstanding quarter-on-quarter growth of 712.4 percent and 367.7 percent respectively.
Southeast Asia collectively recorded the highest contraction rate of IVAs during the period, yielding a dramatic year-on-year decrease of 98.0 percent. When compared with the previous quarter, Singapore (+106.2%) and the Philippines (+105.4%) topped the quarter-on-quarter growth chart.
West Asia outperformed other regions/sub-regions, reporting a better-than-average contraction rate of 63.7 percent for the period.
Not surprisingly, IVAs into the Pacific region also reduced by 92.1 percent year-on-year. Hawaii, however, started to improve its inbound count recording a quarter-on-quarter increase of 678 percent.
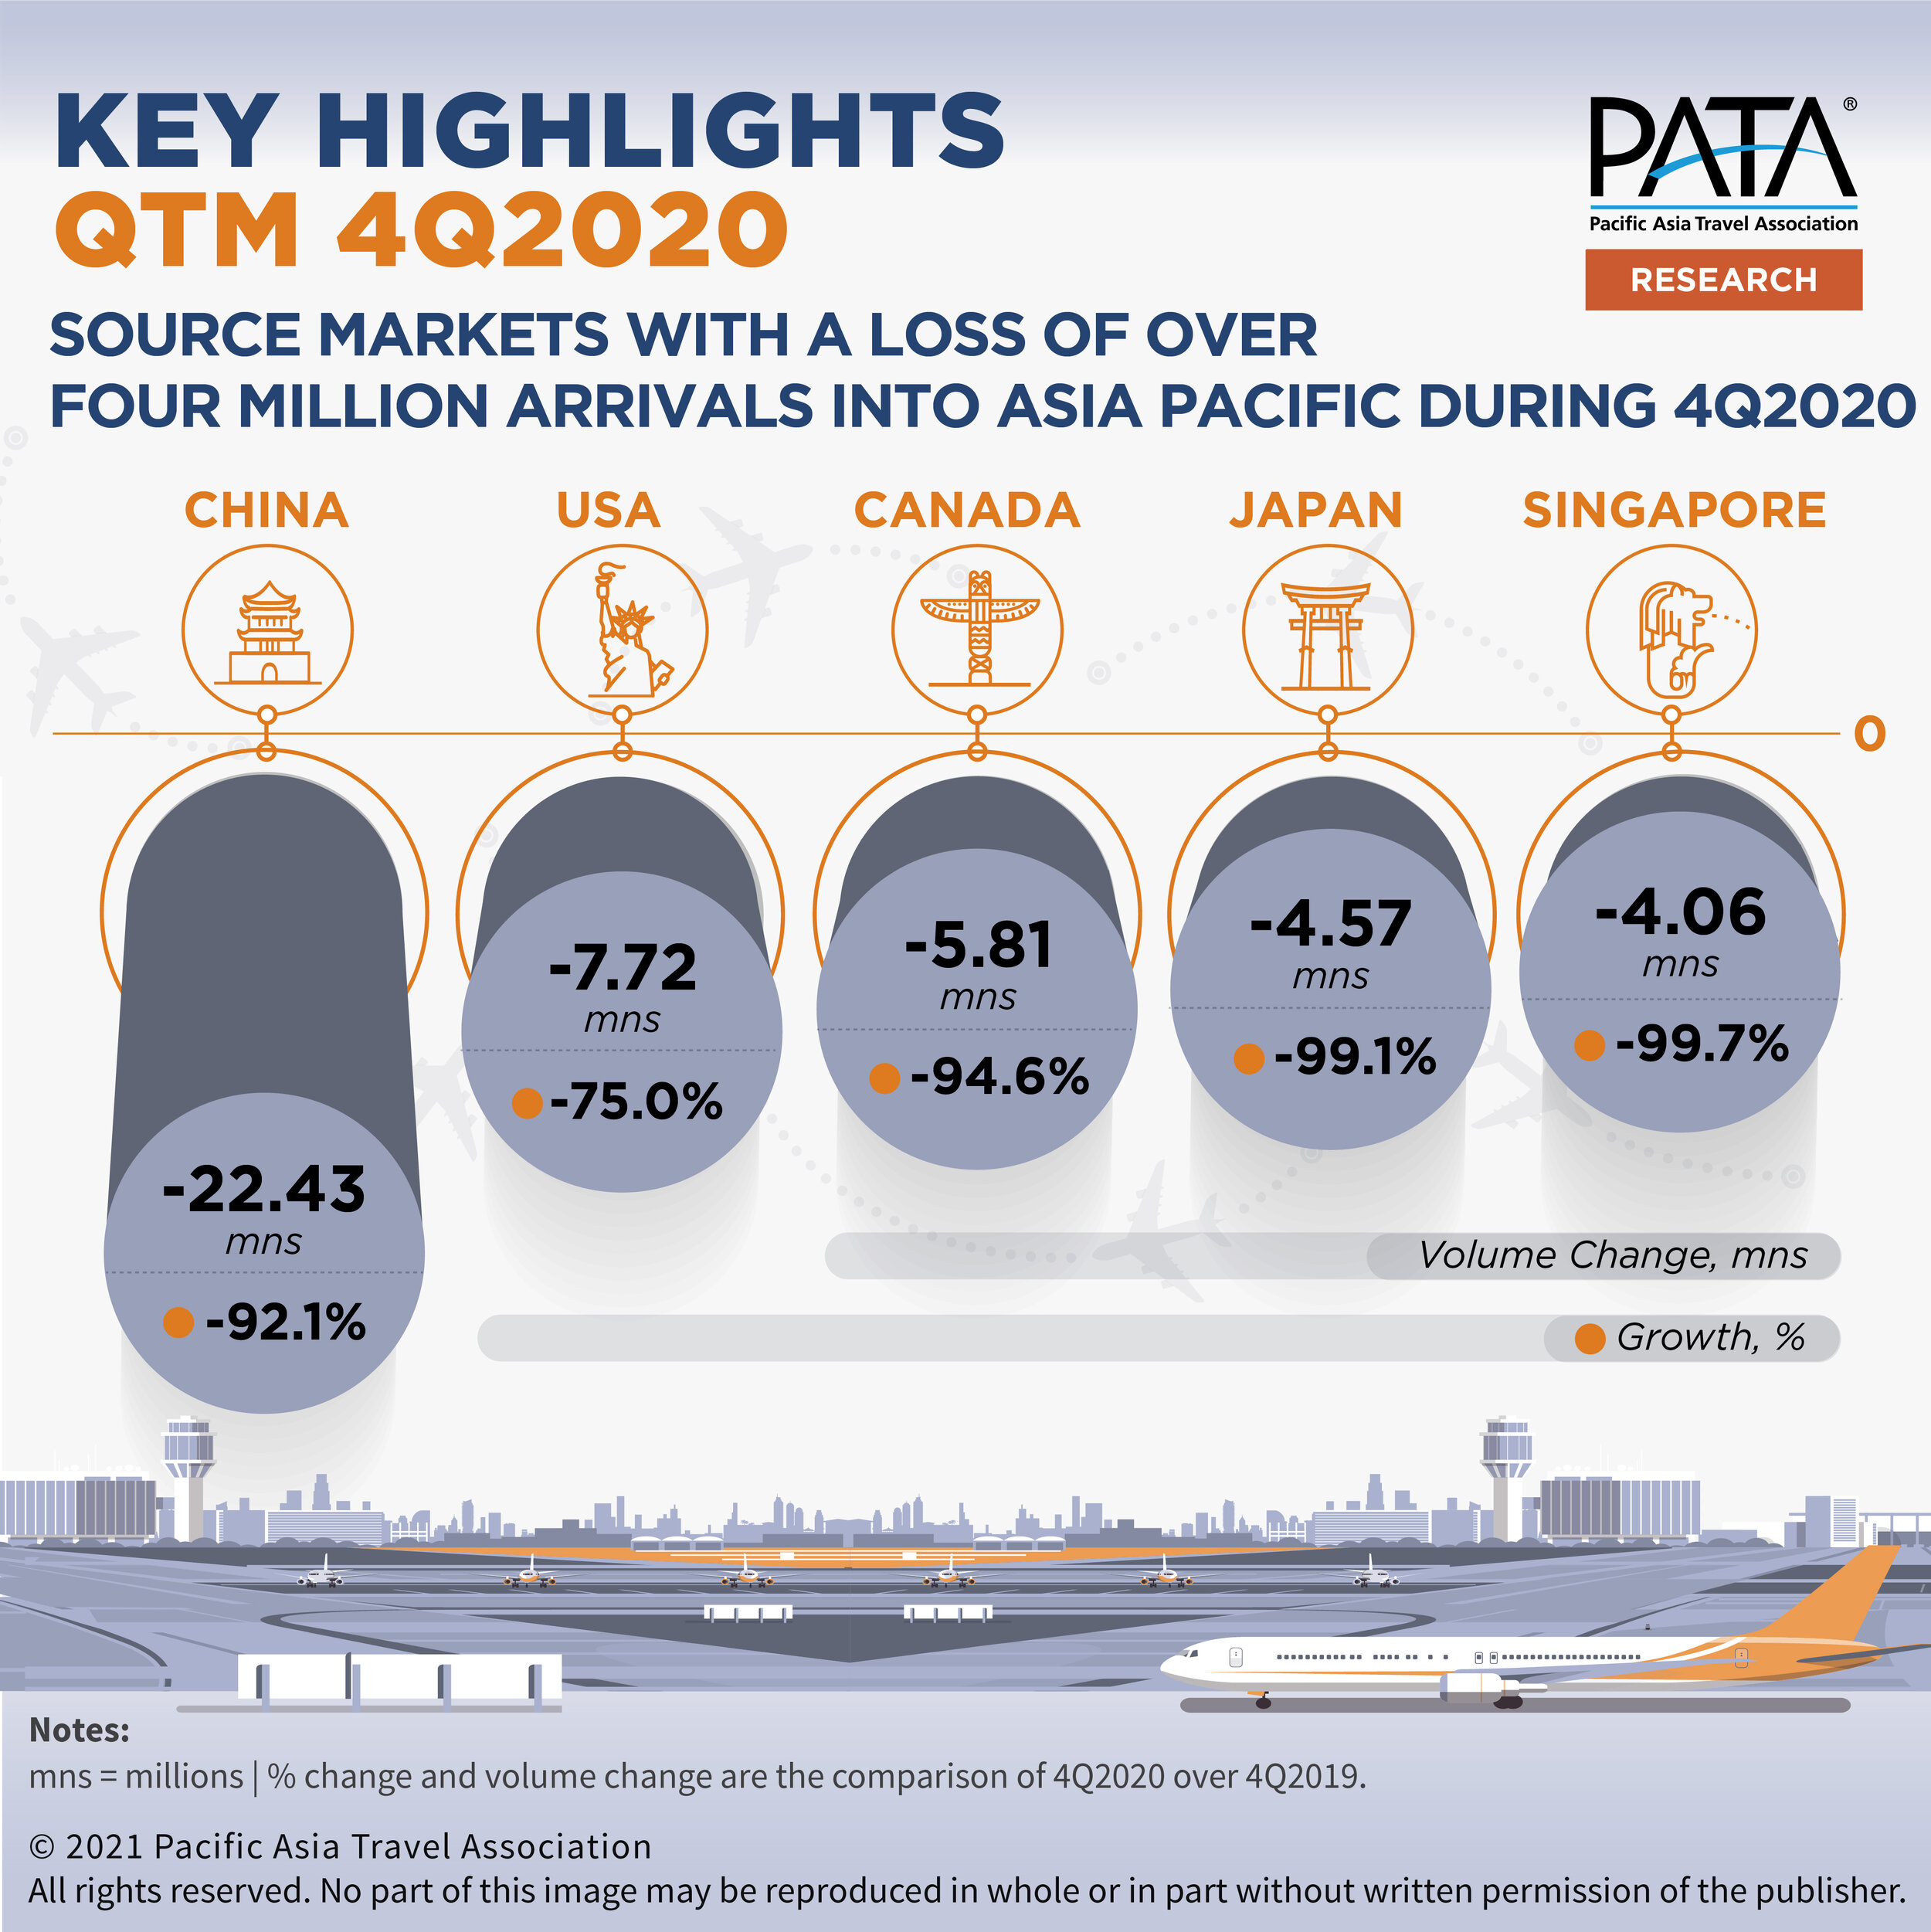
In terms of source markets, arrivals out of China into the Asia Pacific region continued to lose ground with a whopping loss of more than 22 million for the quarter. USA, Canada, Japan, Singapore and Korea (ROK) followed suit, reducing arrivals traffic into the region by more than 4 million each.
Notes:
Figures quoted are as of April 2021.
Growth refers to year-on-year figures recorded in 4Q2020.
Sources:
Respective NTOs/NSOs.
Detailed figures of QTM 2020 for all quarters of the year (Excel data sets) can be purchased below.

If you are a PATA International Member or a PATA Chapter Member, please email us for your discount code.